

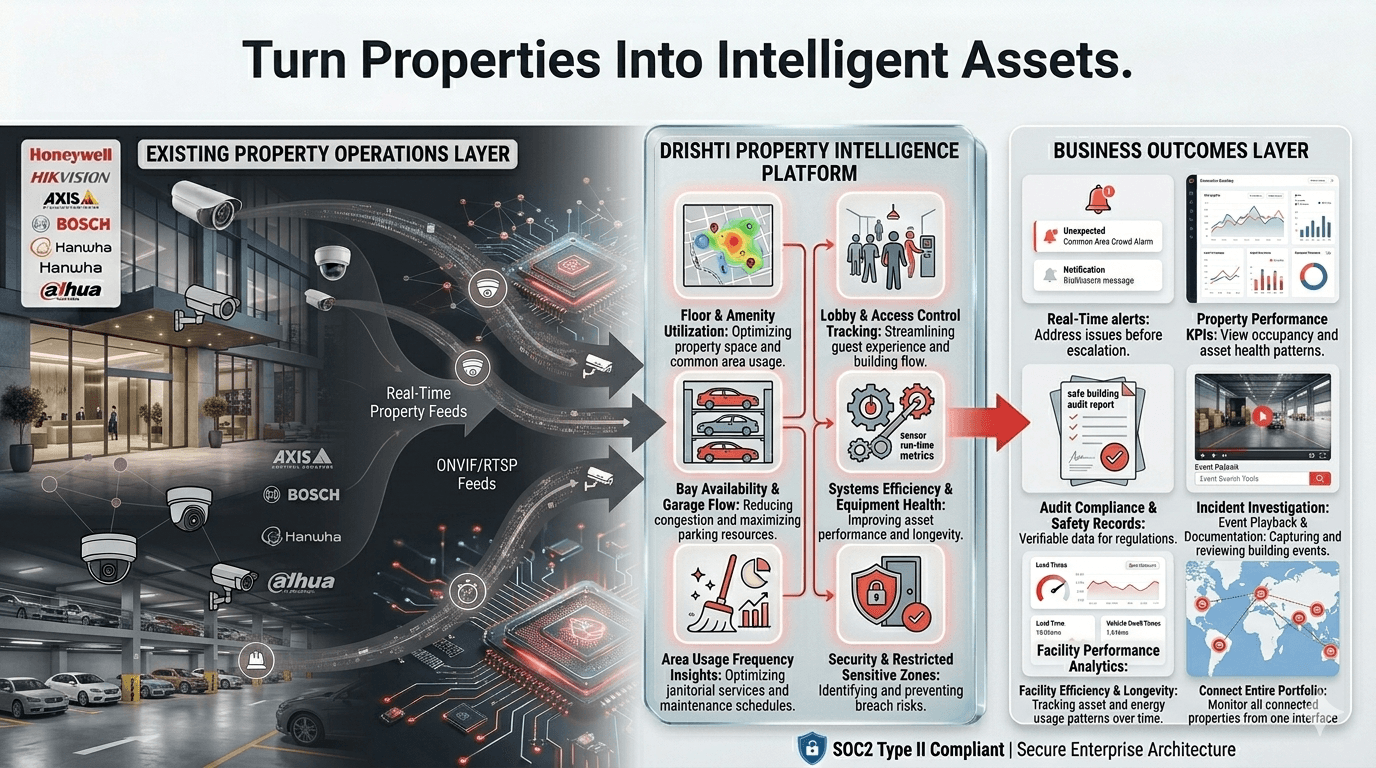
Business problem
Understanding customer engagement is difficult when teams cannot see how long visitors spend in critical zones.
Drishti solution
Measure how long visitors spend in specific locations such as displays, counters, and service areas.
Library benefits
- Improved merchandising
- Better customer experience
- More responsive service design
Sample scenarios
- Display dwell trend
- Service-area wait risk
- Tenant amenity utilization
Buyer context
Retail and QSR operators need store-level visibility into service execution, queue pressure, cleanliness, merchandising, and customer-impacting exceptions across distributed locations.
Signals Drishti can monitor
Teams that use this workflow
Operational outcomes
Sample alerts
Pilot and rollout plan
KPIs to evaluate
Operating workflow
Configure service zones, queue thresholds, cleanup cycles, merchandising review areas, and escalation owners.
Route events to store, regional, or field teams based on site hours and severity.
Compare patterns by location, daypart, and workflow so leaders can coach stores with better evidence.
Sample case studies
These are illustrative GTM examples to help buyers understand deployment patterns. They are not customer claims, customer logos, or guaranteed outcomes.
Retail & QSR
QSR group monitors queue pressure and dining-area standards
A franchise operations team needs earlier signals when checkout queues build and public-area standards slip during peak periods.
Drishti workflow
- Use existing counter and dining-area cameras across pilot stores.
- Create queue and cleanup alerts tied to daypart-specific thresholds.
- Generate weekly regional review summaries for store coaching.
Sample outcome
- More timely staffing and cleanup interventions.
- Clearer view of recurring peak-hour execution issues.
- A stronger operating rhythm for field consultants.
Illustrative sample case study for GTM content, not a claimed customer result.
Governed review workflow
Drishti is designed to support event queues, reviewer decisions, notes, reports, and retention controls so teams can act without turning video into unmanaged data exhaust.